Margin & controls
Earned value and the S-curve, explained simply
Earned value sounds like something for a project-controls department with a PhD. It isn't. For a civil or roadworks contractor it answers the two questions you care about every week: am I behind, and am I over? Here's the whole idea in plain English — and why seeing it at month-end is too late.
The one idea behind earned value
Most cost reports compare two numbers: what you planned to spend and what you actually spent. The trouble is they ignore how much work you've actually done — so your spend can look healthy simply because you're behind. You haven't spent, because you haven't built. Earned value adds the missing third number: the value of the work you've genuinely completed. With three numbers instead of two, you can finally tell "behind schedule" apart from "over budget" — two different problems with two different fixes.
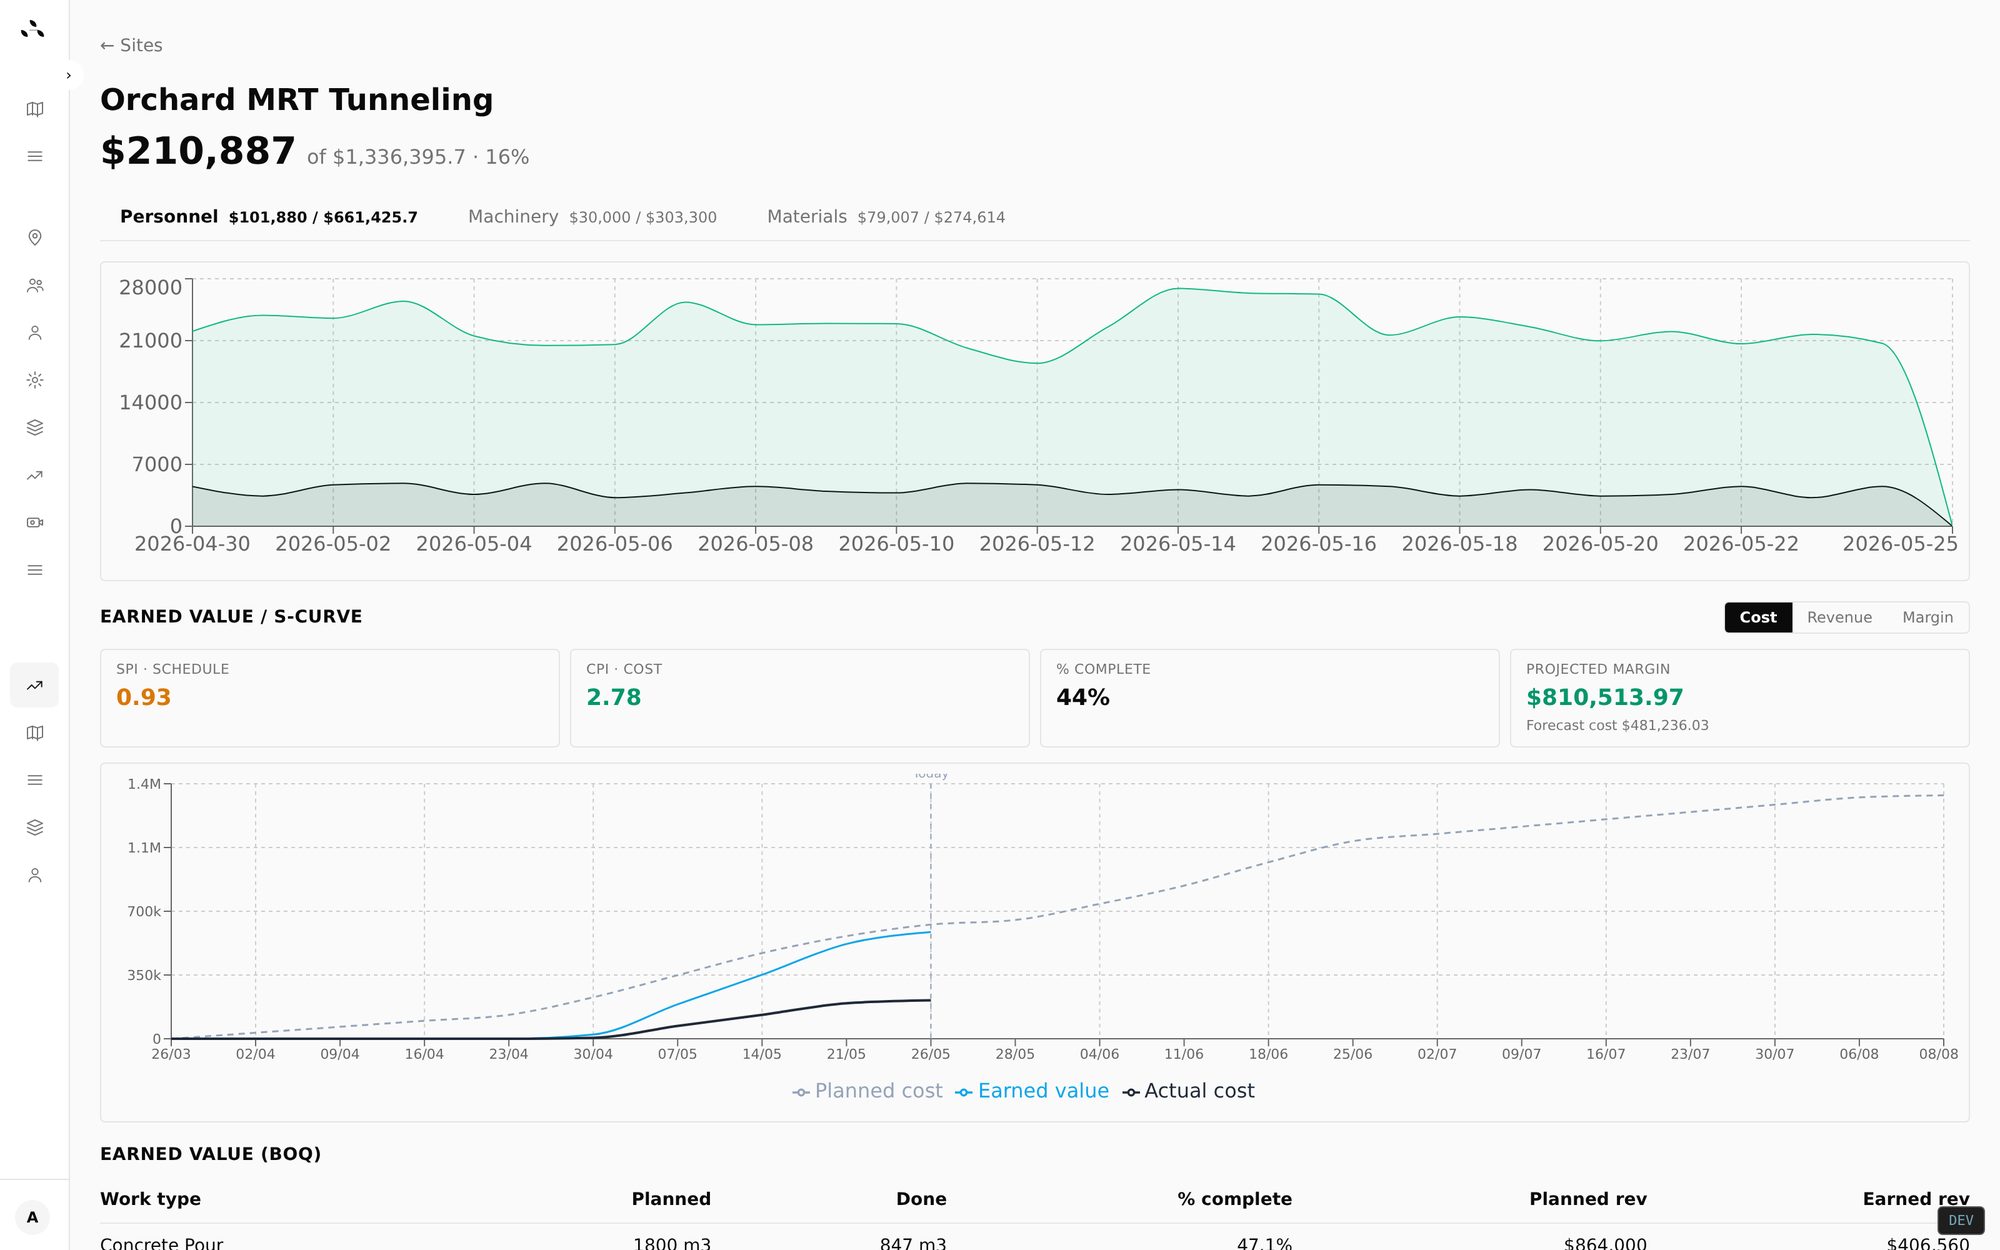
The three lines on the S-curve
Plot cumulative money against time and almost any project draws an S — slow at the start, steep through the middle, tapering at the finish. Earned value plots three of those curves together:
- Planned — the value of work you scheduled to have done by now (your baseline).
- Earned — the value of work you've actually completed by now.
- Actual — what you've actually spent to do it.
The gaps between those three lines are your whole story, at a glance.
SPI and CPI — two ratios, two answers
- SPI (schedule) = Earned ÷ Planned. Below 1, you're behind schedule.
- CPI (cost) = Earned ÷ Actual. Below 1, you're over budget — spending more than the value you're earning.
A worked example: a $1M trench
Say you've got a $1,000,000 trenching job over 10 weeks. It's the end of week 5. Three numbers:
- Planned — the schedule said you'd have completed $500k of work by now.
- Earned — you've actually completed $400k of work.
- Actual — you've spent $450k getting there.
So SPI = 400 ÷ 500 = 0.8 (behind schedule) and CPI = 400 ÷ 450 = 0.89 (over budget). You're behind and over — and you know it in week 5, with five weeks left to recover, instead of finding out at handover when it's a post-mortem.
Why month-end is too late
The numbers only help if they're current. If your earned value is reconstructed from spreadsheets weeks after the fact, a CPI of 0.89 is a coroner's report, not a warning. The entire value of earned value is in its timeliness — catching the drift while there's still job left to fix it.
How Outsite keeps the S-curve live
Outsite builds the three lines from data you're already producing, so nobody has to rebuild a spreadsheet:
- Planned comes from your project plan and BOQ, broken down per span.
- Earned updates every time a daily report is confirmed — the work-done quantities, measured against the plan.
- Actual comes from your costs.
The result is a live SPI, CPI and a forward projected margin on every site — variance shows up the day it happens, not at month-end.
FAQ
Do I need to be a quantity surveyor to use earned value?
No. The three lines — planned, earned and actual — and the two ratios that come from them (are you behind, are you over) are all you need to act. The maths is just division.
What is a good SPI or CPI?
1.0 means you're exactly on plan. Above 1.0 is ahead of schedule (SPI) or under budget (CPI); below 1.0 is behind or over. Anything drifting below about 0.9 deserves attention.
Do I need MS Project or Primavera to do this?
No. Earned value only needs a baseline plan and a steady read on how much work has actually been completed. Outsite takes that read from confirmed daily reports, so the S-curve stays current without separate scheduling software.
How often should I look at the S-curve?
It updates whenever a daily report is confirmed — so in practice, daily. Reviewed once a month it's a post-mortem; reviewed daily it's an early warning.
See the S-curve on your own sites
Outsite gives civil, utility and roadworks contractors a live earned-value S-curve on every project — planned vs earned vs actual, with SPI, CPI and projected margin that update the moment a daily report is confirmed.