/
Outsite finds the margin slipping out of your jobs — hours wasted on data, costs surfacing too late, materials and crews falling through the cracks — and gives the office one live view to plug it. One percentage point at a time.
my.outsites.app
The problem
Every hour chasing data is margin leaking out of the job.
The product
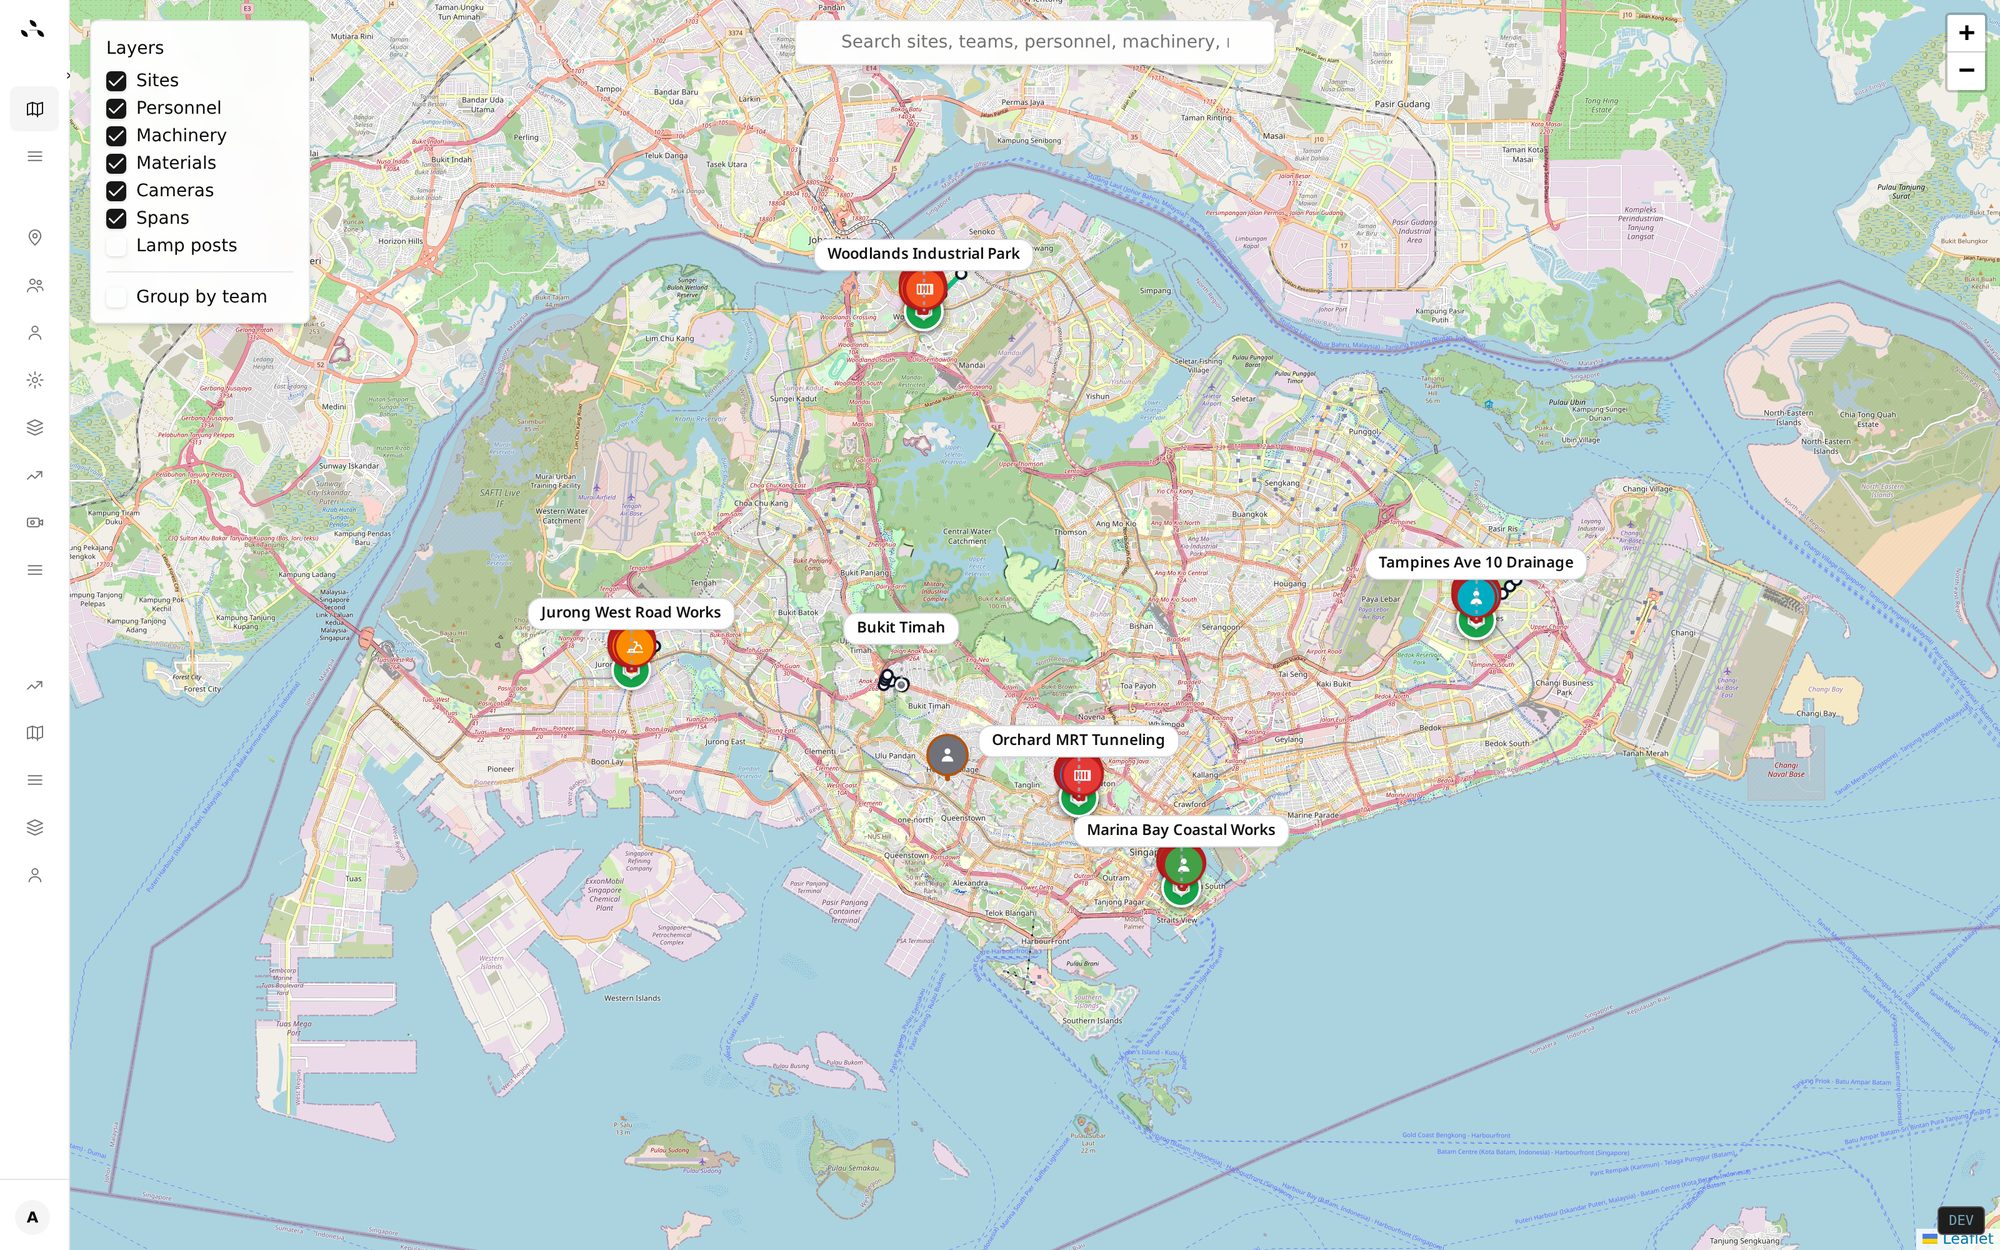
Outsite is a multi-site visibility platform built for scattered, linear works — not single building sites. Six features doing the work of a spreadsheet stack.
/
/admin/progress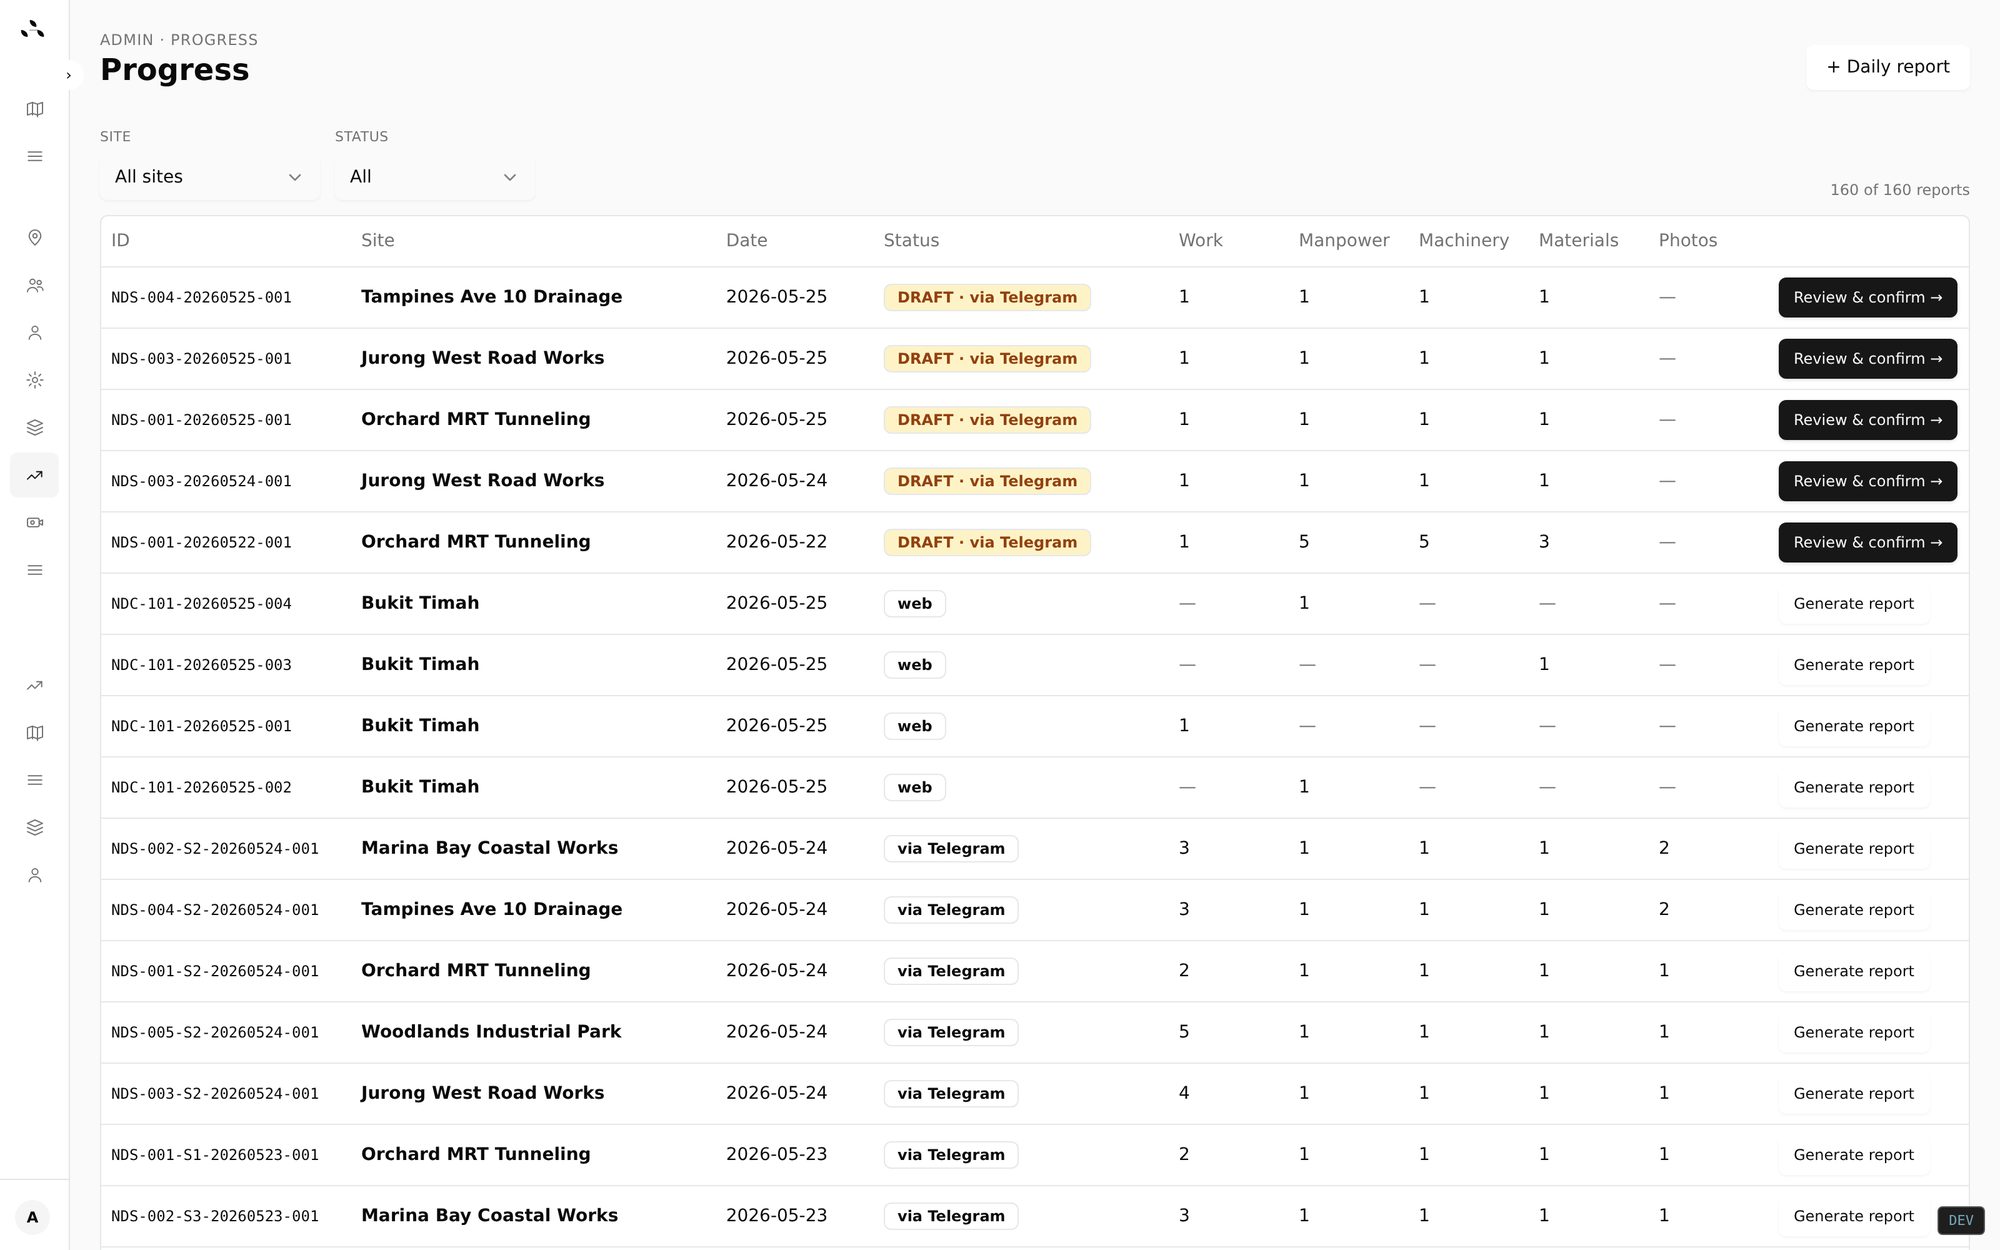
/finance/site/…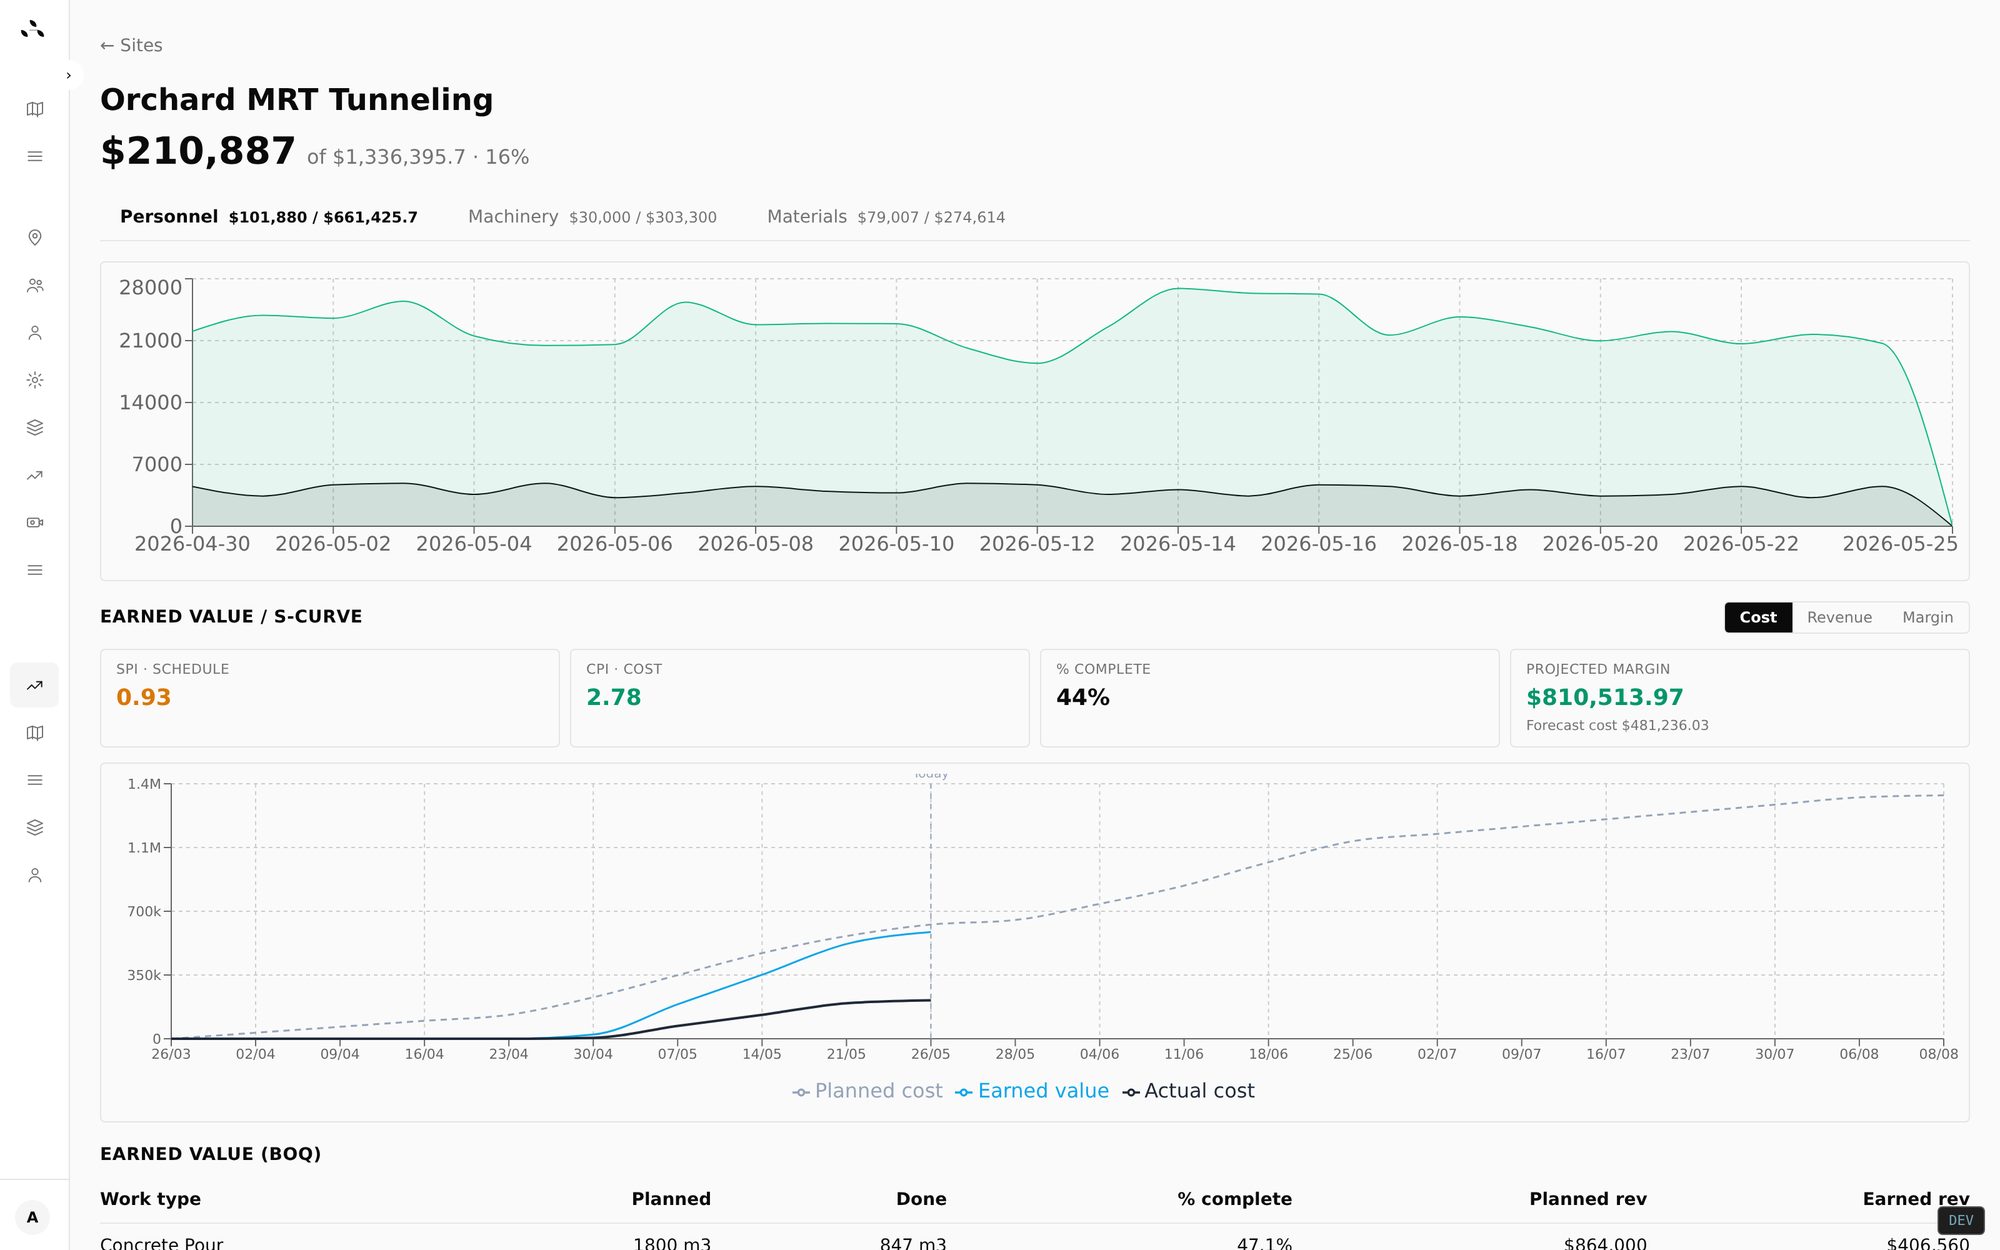
/finance/budgets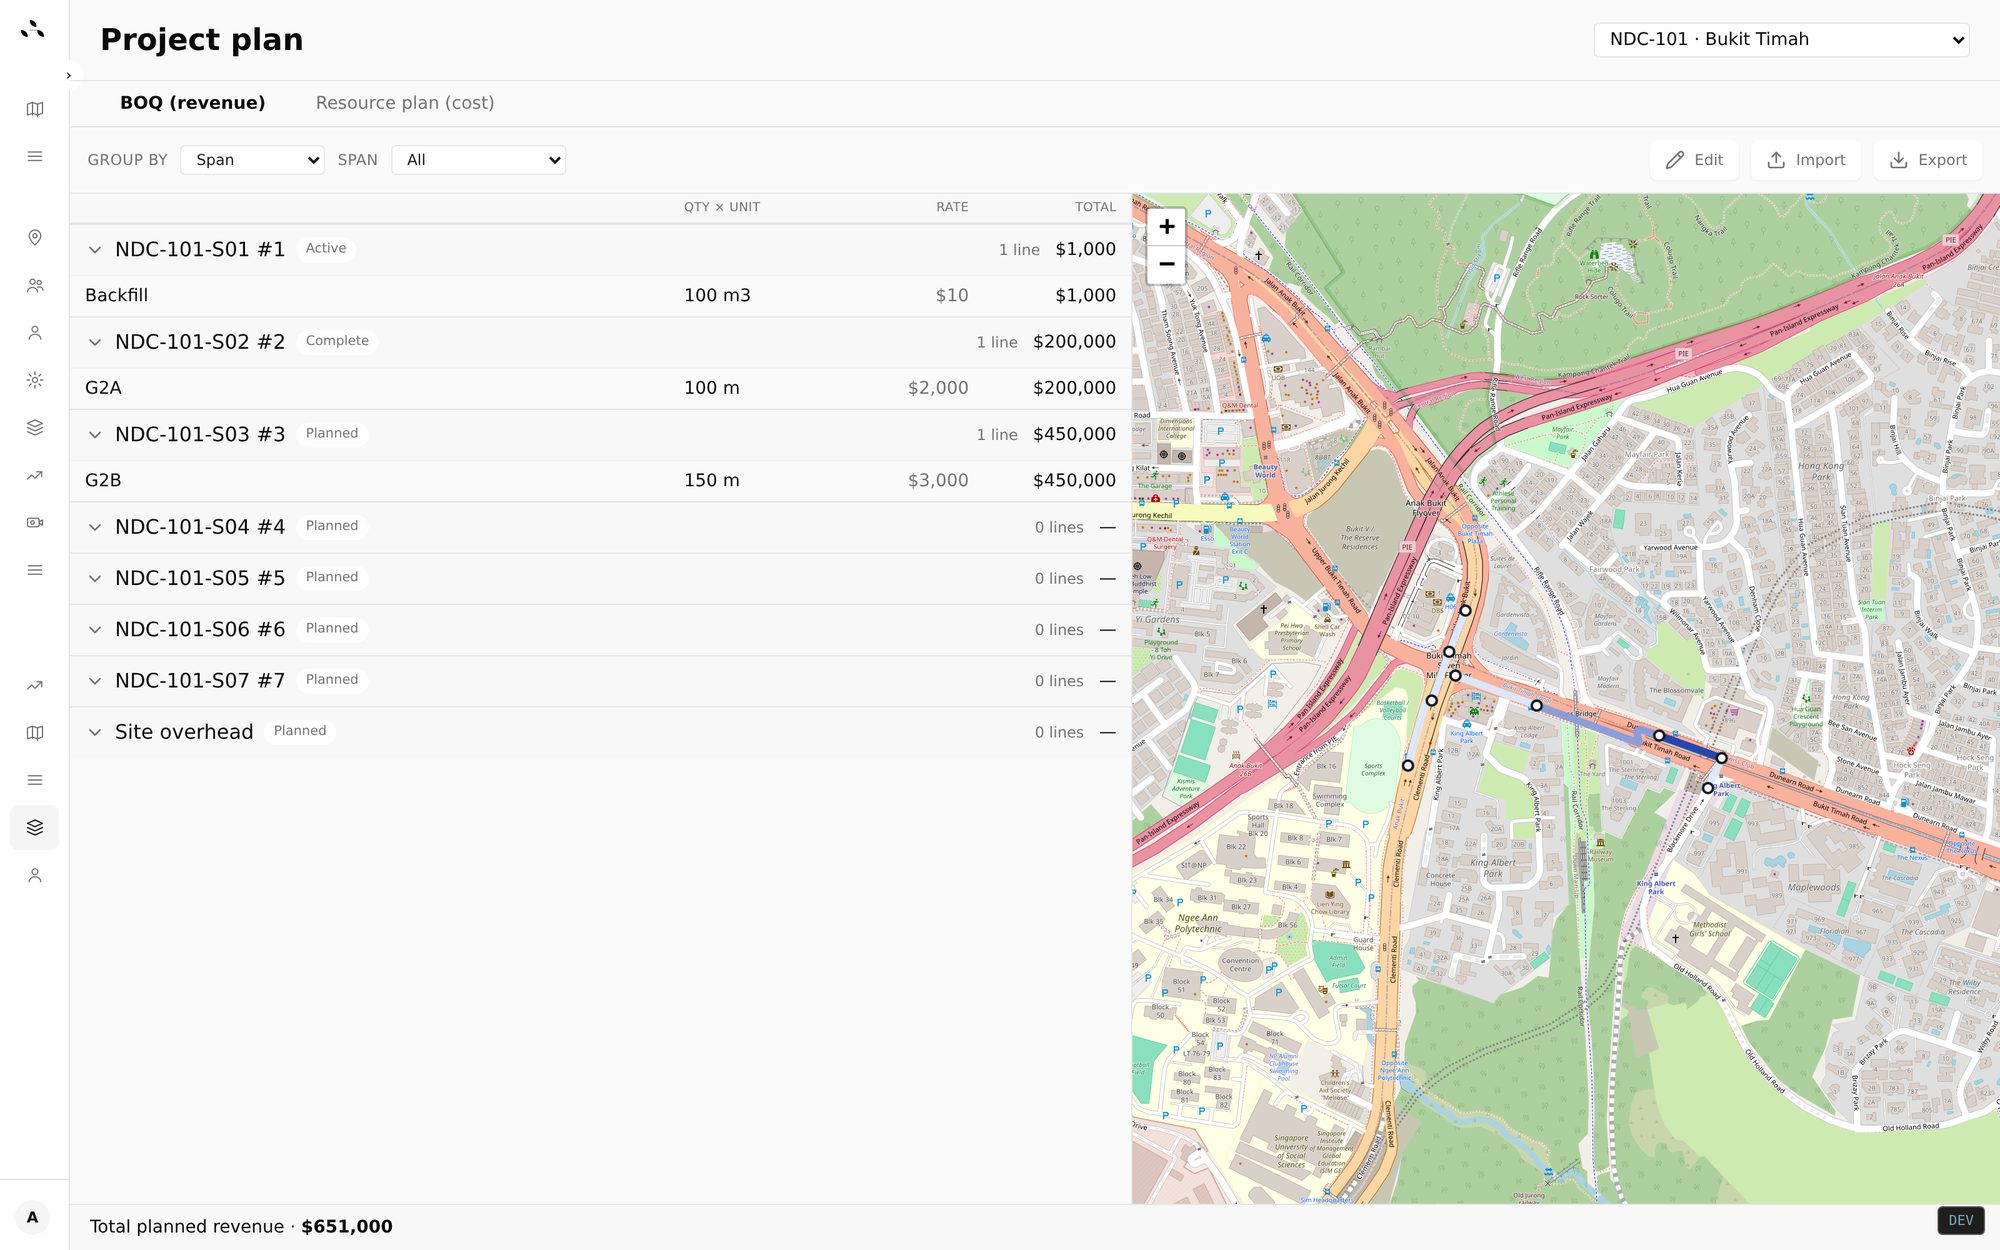
/finance/progress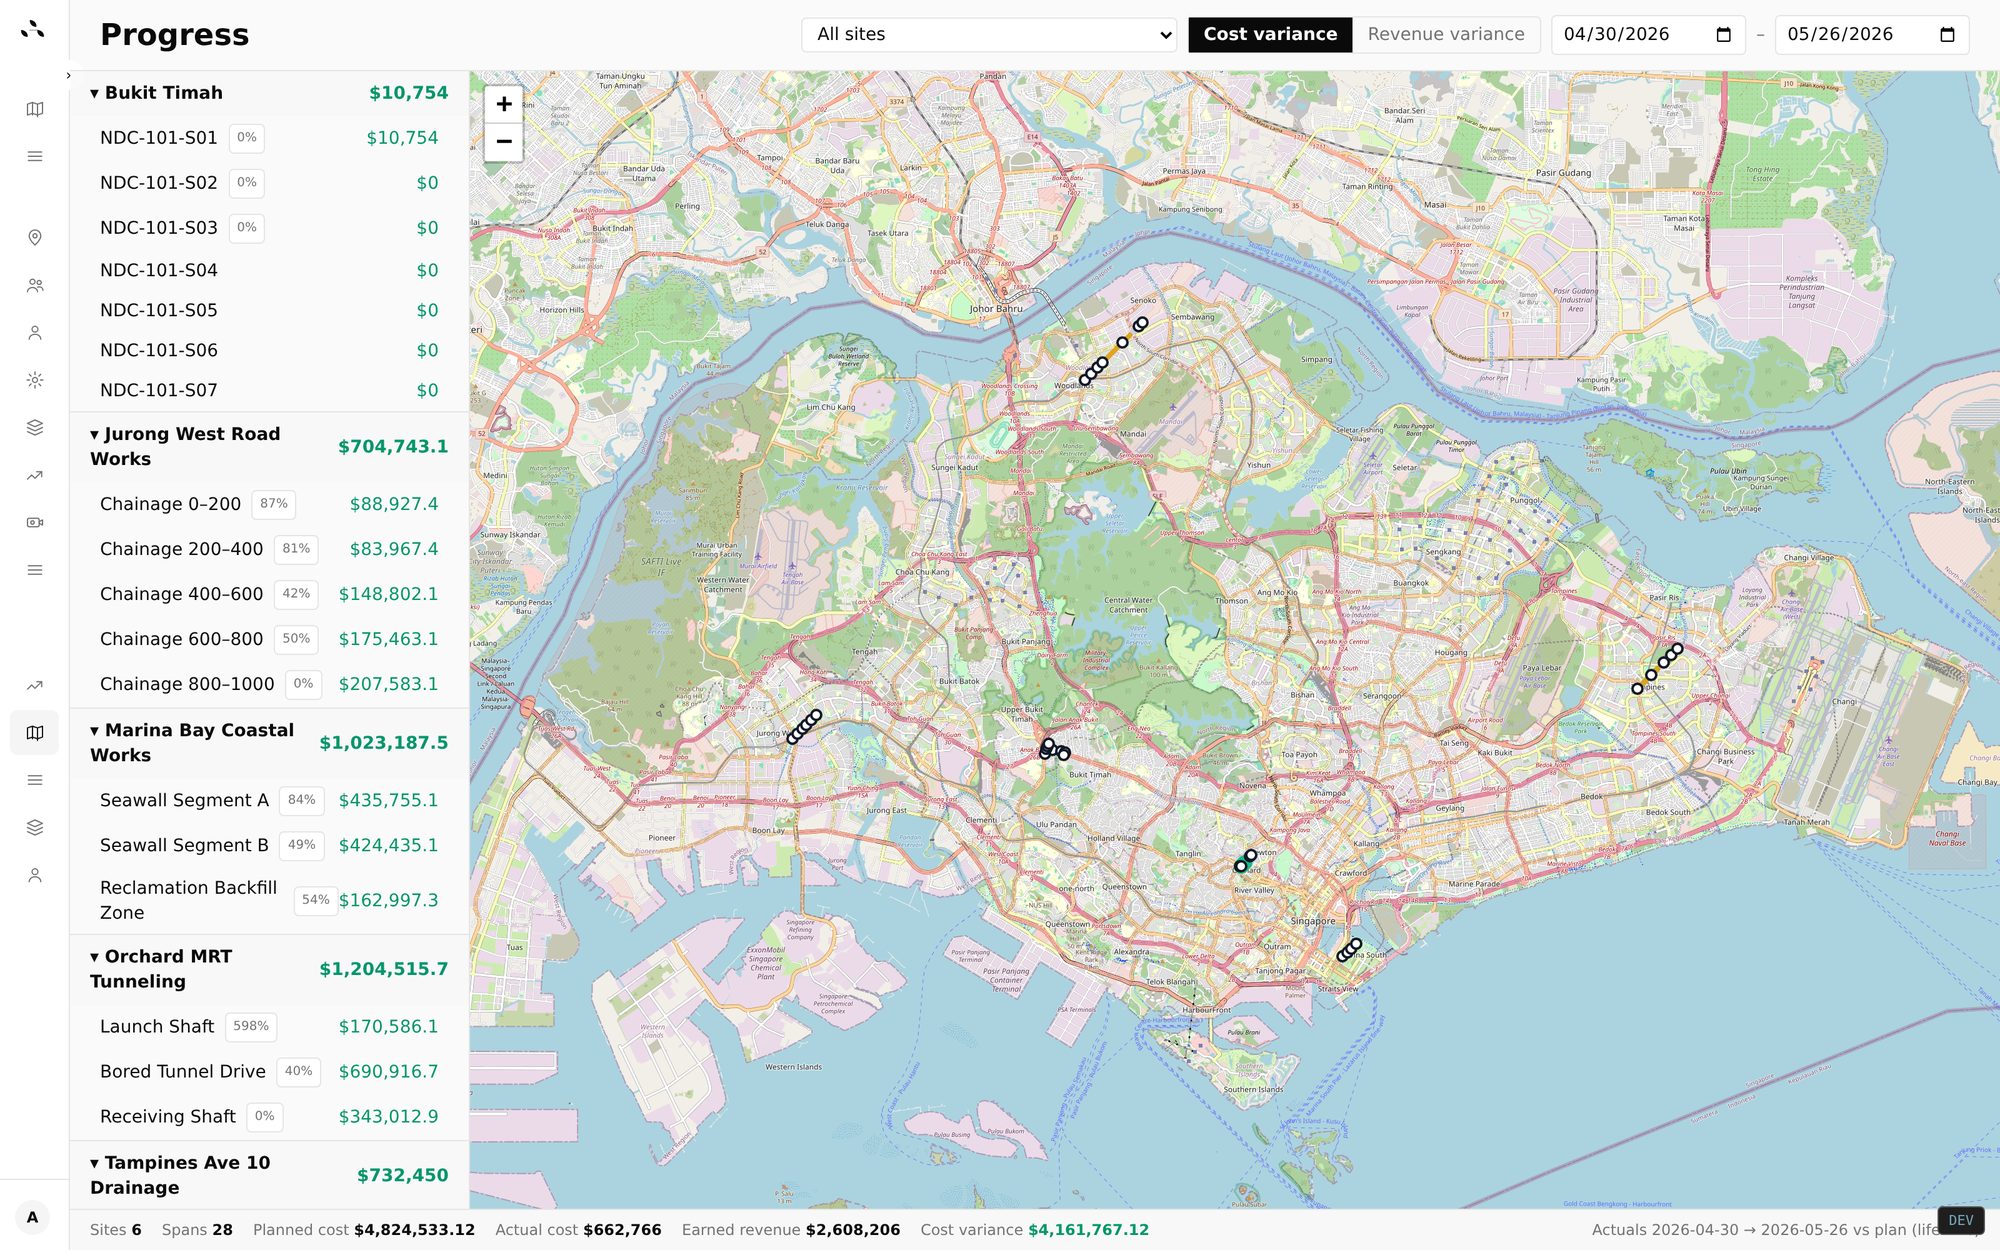
Outsite assistant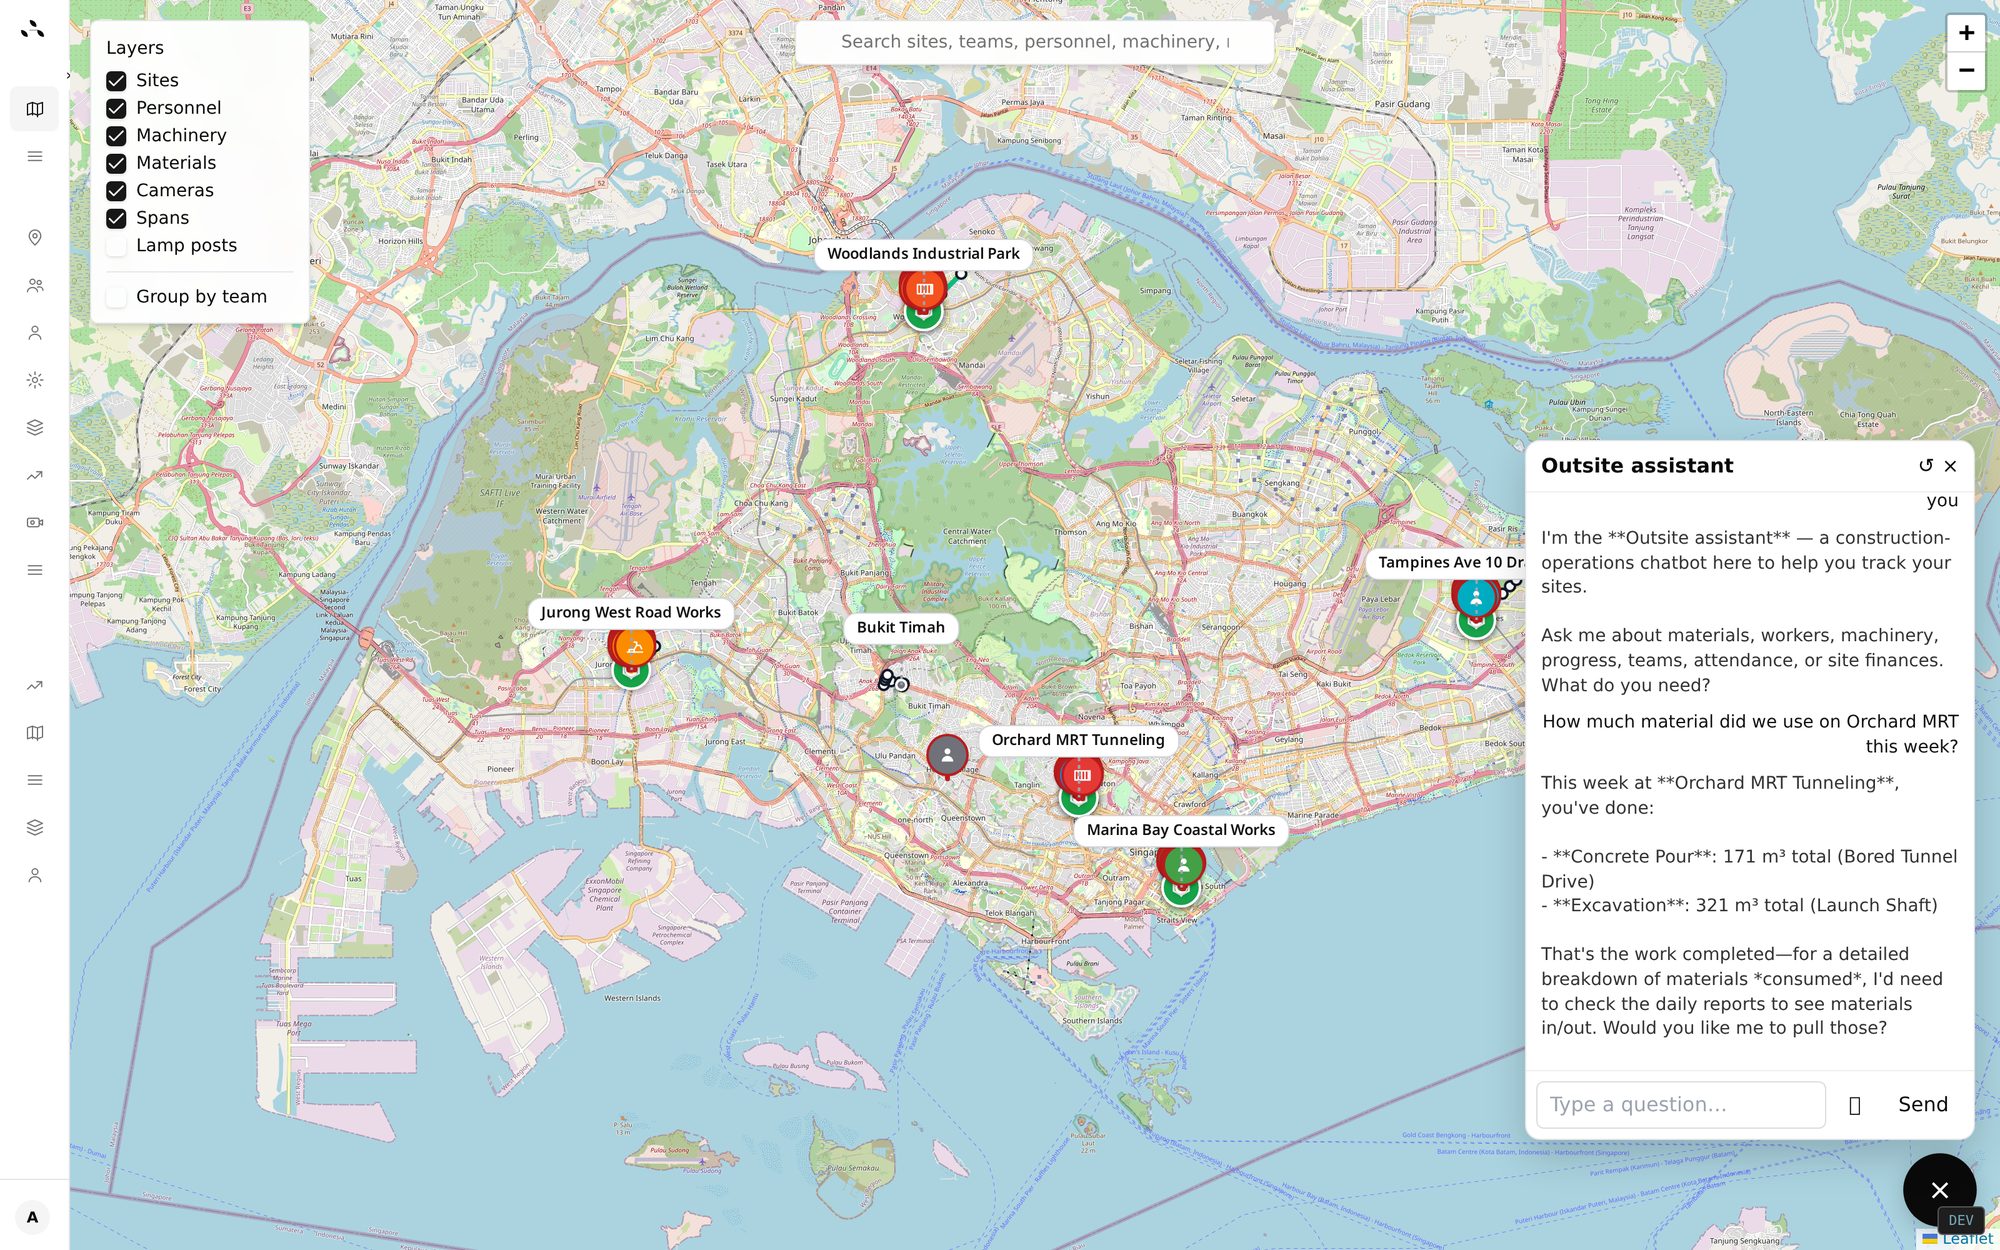
How it works
Step 01
Draw your spans on the map, drop in the BOQ, and Outsite turns it into a live plan — costs, revenue and resources per chainage.
Step 02
Crews send the daily report from Telegram — manpower, machinery, materials, photos, work done. Outsite parses it and stages a draft for confirmation.
Step 03
Live map updates the moment a crew checks in. Margin updates the moment a report is confirmed. No spreadsheets to reconcile.
FAQ
Outsite is a multi-site construction tracking platform for civil, utility and roadworks contractors. It puts every crew, machine and material on one live map, turns Telegram messages into structured daily reports, and tracks earned-value cost and margin on every project.
Contractors running scattered, linear works across several locations — roadworks, cabling, trenching, utilities and other civil projects — rather than a single building site. It's built for the office team that needs one view across all of them.
Yes. Outsite is built multi-site first. Every site, crew, machine and material shows on one live map, and you can group by site, team or work-type. Earned value and progress roll up across the whole portfolio.
No. Crews report from Telegram, which most site teams already use. They send the daily report into the site's Telegram group and Outsite parses it into structured data for the office to confirm — no new app, no per-seat login to chase.
Yes. Outsite breaks linear works into spans and chainages you can plan revenue and resources against. The same span powers the daily report, the BOQ and the live map, so roadworks, cabling and trenching jobs stay in one source of truth.
Most field apps assume one building site with a fixed boundary. Outsite assumes the opposite — work spread across many sites along a line — so visibility, reporting and margin are designed around a portfolio of scattered jobs, not one location.